i made a graph comparing the ddc and eheim 1048.
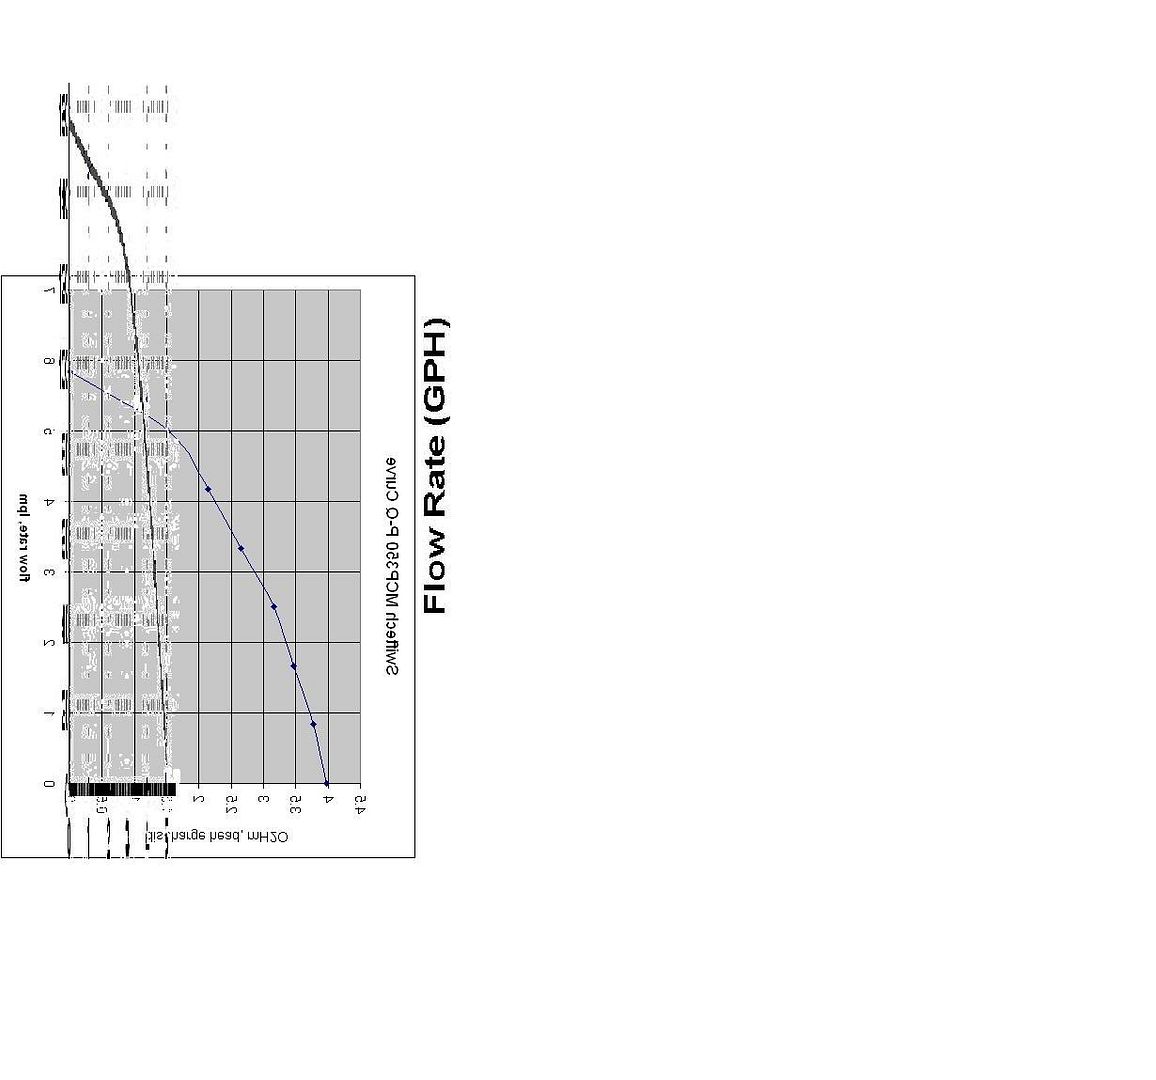
did it by taking eheim's p/q chart and stretching/skewing over the swiftech's ddc chart. to read it, the swiftech chart is lpm in incriments of one, by head in meters, incriments of .5. the eheim chart is gph, incs of 20, and feet, incs of 1. sorry i'm such a lazy bastard that i cant compute each point and render a cleaner graph, but this works if you have the patience to figure it out.